Multi-Channel Smart Metering System
IDECO’s main purpose of the system is to measure power
parameters and power quality from each transformer (2000 transformer). Their requirement
is to have a variety of number of feeders for each transformer, so the solution
should be flexible enough to cover different combinations.
The measurement consisted of:
· MAIN FEEDER
· 4x Voltage (R, Y, B, N)
· 4x Current (R, Y, B, N)
Number of output feeders (X), each has:
· 4x Current (R, Y, B, N)
There are different combinations of
number of feeders, for example:
· Main feeder only
· Main feeder + 2 output feeders
· Main feeder + 5 output feeders
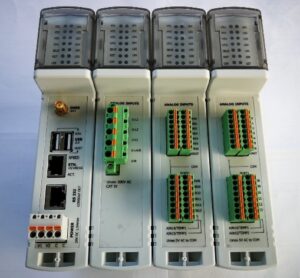
Hardware of the measuring device is based on NI’s sbRIO platform (PAC – Programmable
Automation Controller), A/D converters and signal conditioning in rugged industry grade enclosure.
Hardware parameters:
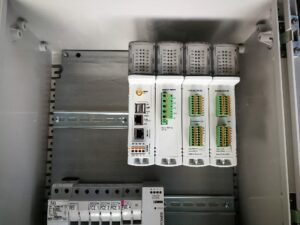
DIN-Rail
mountable device
Voltage Inputs:
· Number of inputs: 4
· Bandwidth: 45Hz to 2.5kHz
· Isolation voltage: 4.2kV RMS, 50Hz, 1min
· Accuracy: +/-0,1%
Current Inputs:
· Option A:
· 4 inputs with 5A range (from 5A output CTs)
· Option B:
· 4 inputs with 5A range (from 5A output CTs)
· 8 inputs with up to 1V range (from 0.33V output CTs)
· Option C:
· 4 inputs with 5A range (from 5A output CTs)
· 16 inputs with up to 1V range (from 0.33V output CTs)
· Option D:
· 4 inputs with 5A range (from 5A output CTs)
· 24 inputs with up to 1V range (from 0.33V output CTs)
· Option E:
· 4 inputs with 5A range (from 5A
output CTs)
· 32 inputs with up to 0.5V range (from 0.33V output CTs)
The firmware part calculating power quality parameters according EN50160 fully
follows requirements described in IEC 61000-4-30 Class A and others (61000-4-7,
61000-4-15)
Main measurement functions are:
· U, I, P, Q, S, frequency, THD U, THD I, Power Factor
· Energies – AP, AQ, AS, APin, APout
· All quantities are per phase and total
· Harmonics – U and I, up to 50
· All the quantitates are calculated on 200ms (10 period basis) according to
IEC 61000-4-30
· Voltage quality according to EN50160, IEC 61000-4-30 Class A (U, freq.,
THD U, flicker, unbalance, harmonics)
· Voltage events according EN50160, IEC 61000-4-30 Class A (dip, swell,
interruption – time, extrema, length)
· Note: Voltage parameters are provided for the main feeder only, as the
output feeders have same voltage as main one
· Data are provided in two ways:
· Real-time – using standard protocol (MODBUS), refreshed every 200ms.
· Historical – the device calculate (gapless) true RMS/average of all above
quantities in user pre-defined interval, for example 1 minute (or 10 minutes
for PQ) and store these data in files in standard protocol (comma/tab separated
txt file). The device is able to hold these data/files for 1 month at minimum
in local storage. The historical data also includes voltage events details
according to EN50160.
· Waveform capture
· In case of trigger, the device captures the waveform
· Trigger can be activated by:
§ Selected quantities (U, I, P, Q, S, freq., PF) crosses specified limits – for example voltage drops below XXX volts
· Waveform means raw voltage/current signal with sampling rate at 128 samples/period
· Waveform length is 10 periods
· Waveforms are stored in files in standard protocol and the device is able to hold at least 100 of them in local storage
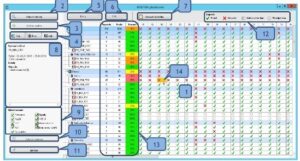
All meters will be integrated into PQ Master System. The PQ Master System gives the users following functions:
· Automatic reading of real-time and historical data from the meter(s)
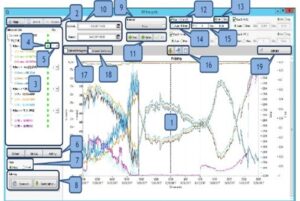
· Displaying real-time data to multiple clients in the local network in multiple visualization panels including tables, graphs, single line diagrams, voltage/frequency profiles, vectors, harmonics, digital indicators.
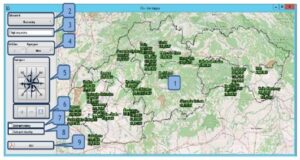
· Displaying map of the region showing actual voltage/frequency per substation or area, including graphical warning for actual voltage level
· Allowing the clients to configure meter(s) for event detection
· Informing about new events including real-time disturbance
· Manual generation of events
· Sending messages & notifications (SMS, e-mail)
· Storing the historical data into the SQL database
· Generate exports and event PDFs automatically
· Automatic send of PDF reports in case of event
· Allowing multiple clients to analyze the historical data and make protocols using web-based post processing (using Internet Explorer)
· Maintains user levels/rights for meter(s) configuration
